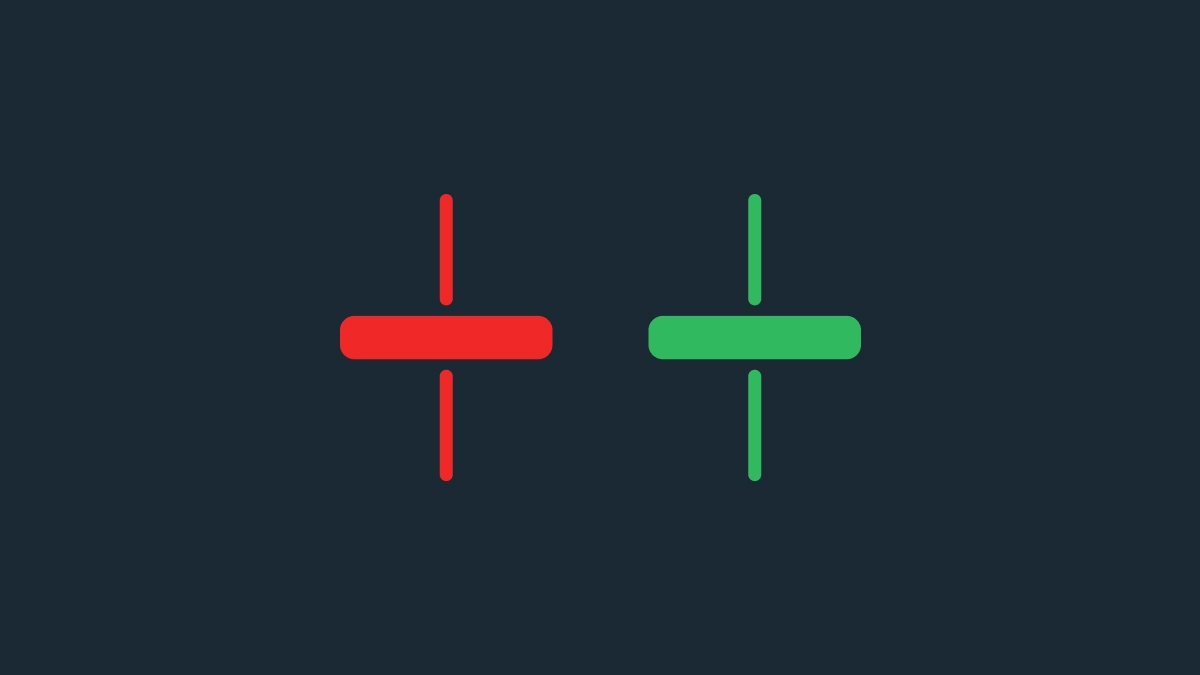
The Heikin Ashi trading strategy
Just like a traditional candlestick chart, the Heikin Ashi is easy to read and understand. It’s straightforward, so you don’t need to make any complicated assessments. This type of chart is built for swing trading and works best with longer timeframes like the 4-hour or daily charts, because these will give you the cleanest signals. Below is a simple strategy for trading with Heikin Ashi candles.
Wait for a trend
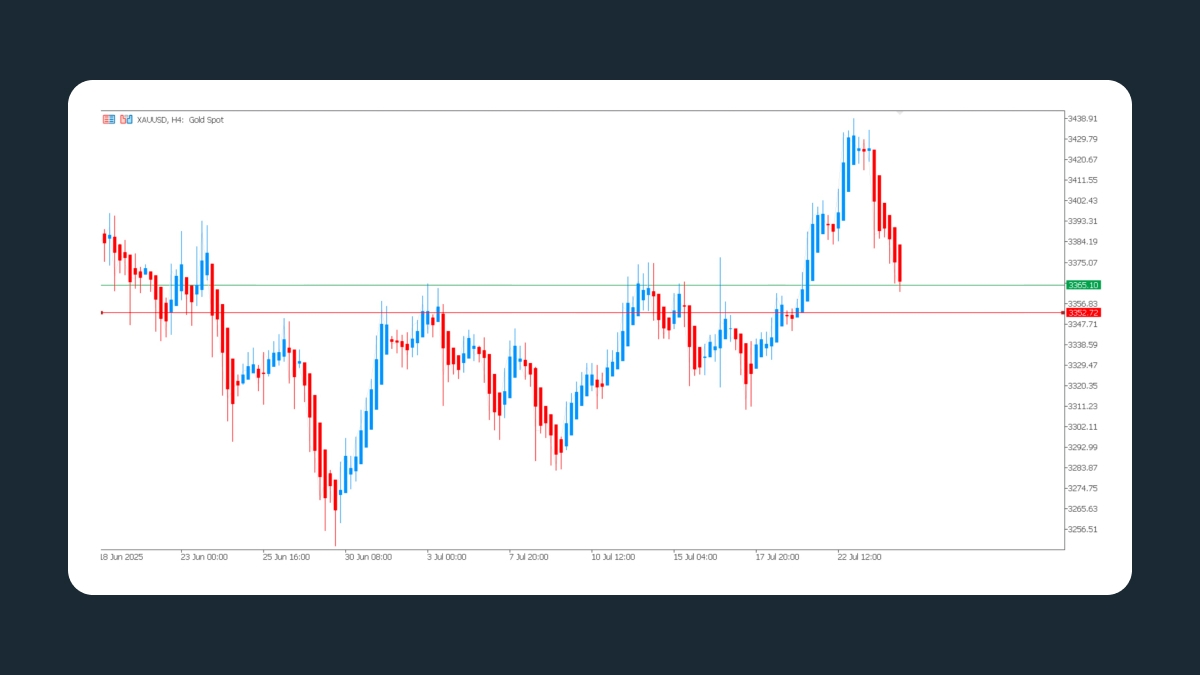
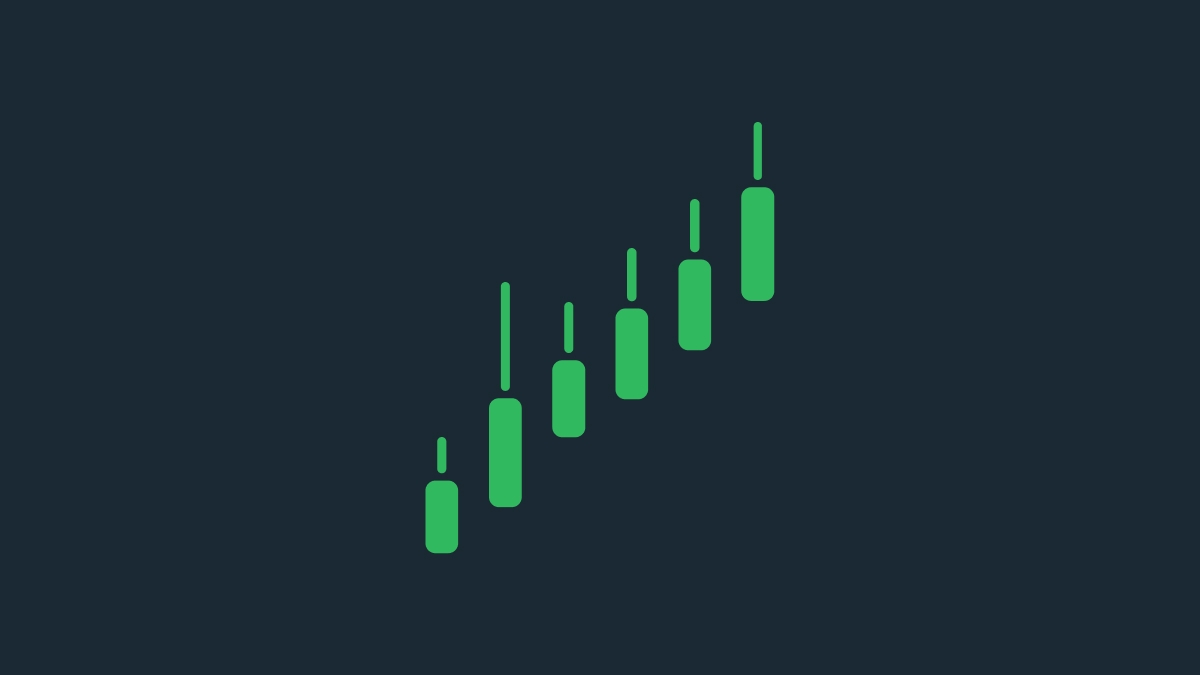
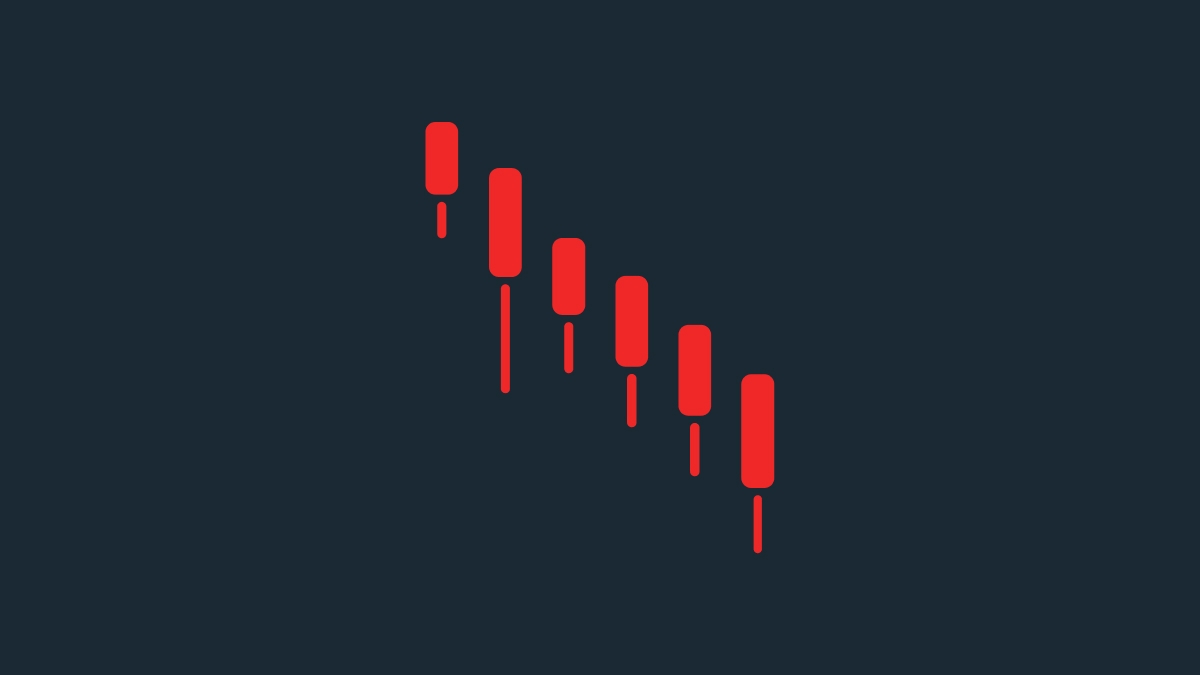
To start, spot the trend. At least three candles of the same color are a good place to start. This will tell you that momentum is going in a clear direction. If you see a mix of colors and wicks or a lot of back-and-forth movement, your trend sequence hasn’t formed yet.
Wait for a Doji or pullback
Trends sometimes take pauses during their momentum. If you see a Doji candle in the middle of a trend, wait for the next candle. If the next one continues in the same direction, that’s your confirmation that the trend is continuing.
Set a realistic stop-loss
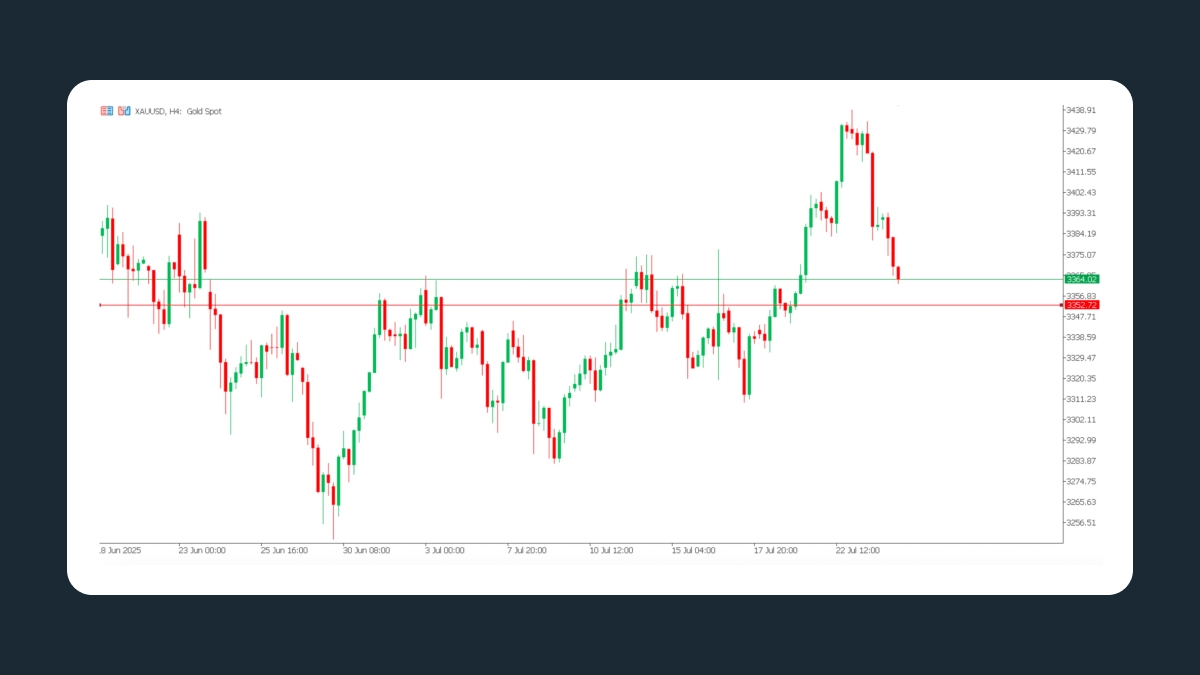
Switch to a regular candlestick chart to set your stop-loss at the most recent swing high or low for your stop. You shouldn’t base it on the highs or lows of Heikin Ashi candles because they are averages and not the real prices.
Exit when you see weakness
Now that you’ve entered the trade and managed risk with a stop-loss, it’s time to find an exit point. This can be after you see the first sign of reversal, such as a different wick, a color change, or a Doji. Try to catch it before the trend actually reverses.
Pairing Heikin Ashi candles with other indicators
You can combine the Heikin Ashi chart with other tools like moving averages, the Relative Strength Index (RSI), and the Average True Range (ATR) to increase your probability of success.
Moving averages
A moving average is a line on a chart that shows the average price of an asset over a period of time, such as 50 or 100 days. An Exponential Moving Average (EMA) will do the same, but giving more weight to recent prices so it reacts more quickly to recent price changes. If the asset price is currently above the EMA, the trend is likely moving up, and vice versa. You can therefore use these to confirm and ride the trend.
Relative Strength Index (RSI)
The RSI helps you see whether an asset is overbought (over 70) or oversold (under 30). You can use it to confirm whether you’re entering a strong trend or chasing one that’s coming to an end.
Average True Range (ATR)
The ATR is a tool that shows you what the average price swing is. You can use it to find a realistic price for your stop-loss, such as setting it just outside the asset’s usual price swing. This helps you find the right balance between avoiding getting stopped out of a good trade and taking excessive risk.
Common mistakes to avoid
Heikin Ashi charts have their pros and cons, and will be useful, or not, depending on your trading strategy. Every trading tool has a specific purpose, and it doesn’t make sense to use it for something else. You shouldn't use an air fryer to boil pasta, and likewise you shouldn't use Heikin Ashi candles for trading strategies that aren't adapted to it. Below are some of the most common mistakes traders make when trading with Heikin Ashi candles.
- Using the chart to scalp
If you try to use a Heikin Ashi chart to scalp and place quick trades using short periods like the 1-minute chart, the delay will mislead you. By the time a candle confirms a move, the price may already be different. That’s why Heikin Ashi candles work better on longer timeframes like the 4-hour or daily chart, where quick reactions matter less and trend clarity matters more. - Using Heikin Ashi candles to set stop-losses or target levels
If you set your stop-loss or profit-taking limit based on the highs and lows of a Heikin Ashi candle, you might get stopped out too soon or miss your target completely. That’s why you should always check the actual price levels on a regular candlestick chart before placing orders. - Trading without confirmation
A Doji or a sudden color change can be tempting, but you should wait for confirmation before jumping in too hastily. Waiting for the next candle or looking for support from another indicator is always a good idea. - Using Heikin Ashi candles to guess turning points
Heikin Ashi charts aren’t made for catching perfect tops or bottoms. They make it easier to follow trends because they’re great for showing when momentum is strong, but they won’t tell you the exact moment a trend starts or ends.
How to find the Heikin Ashi chart on your platform
TradingView: Just change the chart type to “Heikin Ashi.”
MetaTrader 5 (MT5): Go to Insert → Indicators → Custom → Heikin Ashi.
MetaTrader 4 (MT4): This requires a custom indicator you can find for free online.
Schwab and Thinkorswim: Change the chart settings.


